Energy generated by wind in four countries là một chủ đề dạng biểu đồ cột xuất hiện trong đề thi IELTS Writing Task 1 tháng 10. Bài mẫu dưới đây của thầy Nguyễn Tuấn Ngọc sẽ hỗ trợ các bạn trong việc phân tích đề bài, xây dựng dàn ý và ghi chú những từ vựng quan trọng.
1. Phân tích và hướng dẫn
1.1. Đề bài
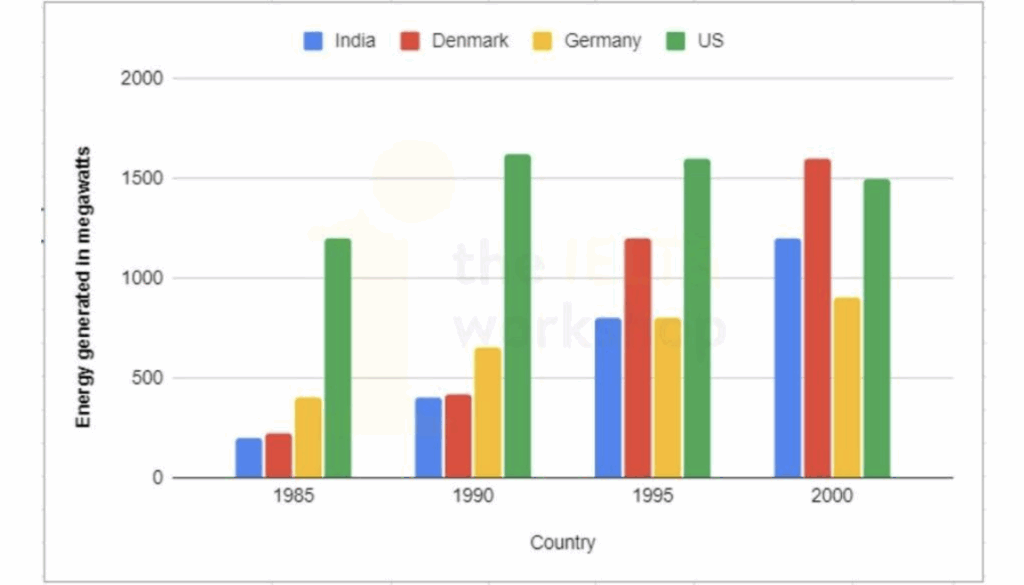
The bar chart shows the amount of energy generated by wind in four countries from 1985 to 2000. Summarise the information by selecting and reporting the main features and make comparisons where relevant.
(Biểu đồ dạng thanh thể hiện lượng năng lượng do gió tạo ra ở bốn quốc gia từ năm 1985 đến năm 2000. Tóm tắt thông tin bằng cách lựa chọn và báo cáo các đặc điểm chính và so sánh khi có liên quan).
1.2. Phân tích đề bài
Dạng bài: Bar chart
Key words: the amount of energy generated by wind, in four countries, from 1985 to 2000.
Xem thêm: Các bước làm bài IELTS Writing Task 1 Bar Chart bạn cần phải biết
1.3. Dàn bài chi tiết
OVERVIEW
- The US was the leading producer of wind energy from 1985 to 1995.
- Denmark showed the most significant growth and eventually overtook the US in 2000 to become the top producer.
- India and Germany also recorded steady increases throughout the period, although their figures remained comparatively lower.
BODY 01: Denmark & the US
- The US consistently remained the largest producer from 1985 to 1995, peaking in 1990 before experiencing a slight decline.
- Denmark, on the other hand, saw substantial expansion. Its output tripled by 1995 and continued rising, eventually surpassing the US in 2000.
BODY 02: India & Germany
- Germany experienced gradual and steady growth across all four years.
- India showed a similar pattern between 1985 and 1990, with modest increases.
- By 1995, India’s production had doubled, reaching the same level as Germany.
- In 2000, India’s output rose sharply to its peak, overtaking Germany to become the third-largest producer, although still far below Denmark and the US.
2. Bài mẫu
The chart compares the amount of wind power generated in four countries—Denmark, the United States, Germany and India—across four different years: 1985, 1990, 1995 and 2000, measured in megawatts.
Overall, the US was the leading producer of wind energy from 1985 to 1995, while Denmark showed the most dramatic growth and eventually overtook the US by 2000 to become the top producer. Germany and India also experienced steady increases throughout the period, though their output remained comparatively lower.
In terms of Denmark and the US, the latter consistently remained the dominant producer between 1985 and 1995, with figures far exceeding those of the other three countries. Its capacity rose sharply from about 1,250 megawatts in 1985 to around 1,600 in 1990, before growth abruptly halted and even reversed slightly to roughly 1,550 by 1995. Denmark, by contrast, began at a much lower level—below 500 MW in 1985 and 1990—but experienced an impressive surge by 1995, with output tripling to approximately 1,250 MW. This upward trajectory continued, and by 2000, Denmark’s capacity rose by a further 30% to reach a peak of 1,600 megawatts, surpassing the US, whose output continued to fall modestly to around 1,500.
Regarding Germany and India, both countries experienced steady increases between 1985 and 1990. By 1995, India’s output had doubled to around 800 MW, placing it on par with Germany. A notable shift occurred in 2000, when India’s production rose sharply to approximately 1,250 MW—its highest level during the period—allowing it to overtake Germany and become the third-largest producer overall, though its figure remained considerably lower than those of Denmark and the US.
Sample by Nguyen Tuan Ngoc – IELTS Teacher at The IELTS Workshop
3. Từ vựng
- overtake /vượt qua
- dominant producer /nhà sản xuất chiếm ưu thế
- far exceeding /vượt xa
- on par with /ngang bằng
- a notable shift /một sự chuyển biến đáng chú ý
- capacity rose sharply /công suất tăng mạnh
- growth abruptly halted /tăng trưởng đột ngột chững lại
- reversed slightly /giảm nhẹ trở lại
- impressive surge /mức tăng đột phá, ấn tượng
- output tripled /sản lượng tăng gấp ba
- upward trajectory /xu hướng tăng liên tục
- a further 30% /tăng thêm 30%
Tạm kết
The IELTS Workshop mong rằng bài mẫu IELTS Writing Task 1 do thầy Nguyễn Tuấn Ngọc hướng dẫn với chủ đề Energy generated by wind in four countries trên đã giúp bạn hình dung rõ cách tiếp cận và triển khai một bài viết hoàn chỉnh dạng bài Bar Chart trong IELTS Writing Task 1.
Tham khảo thêm: [Cập nhật liên tục] Tổng hợp đề thi IELTS Writing 2025 kèm bài mẫu và Bài mẫu Writing Task 1 trên website. Đây là nguồn tài liệu hữu ích để bạn luyện kỹ năng mô tả số liệu, rèn khả năng so sánh và nắm bắt xu hướng trong biểu đồ từ đó nâng cao hơn band điểm của mình.
Ngoài ra, đừng quên tham khảo HỌC IELTS MIỄN PHÍ trên website – cơ hội để học 4 kĩ năng trong bài thi IELTS cùng giảng viên giàu kinh nghiệm giảng dạy. Đăng ký ngay để nâng cao kỹ năng và sử dụng tiếng anh thành thạo hơn!