Bài viết dưới đây do thầy Nguyễn Tuấn Ngọc – giáo viên dày dặn kinh nghiệm tại The IELTS Workshop biên soạn với đề bài: The charts below show the proportion of graduates with different qualifications working in one engineering company in 1980 and 2008. Hy vọng rằng sau bài viết, bạn có thể có thêm nhiều góc nhìn khác nhau và nhớ học thêm những từ vựng mới ở phía bên dưới nhé.
1. Phân tích đề bài
1.1. Đề bài
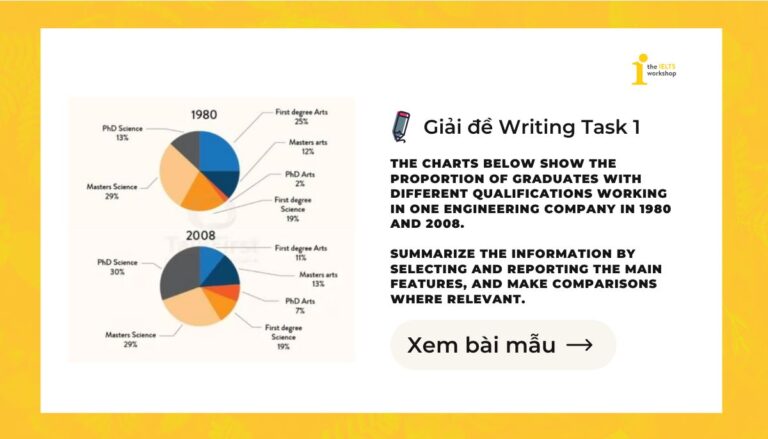
The charts below show the proportion of graduates with different qualifications working in one engineering company in 1980 and 2008. Summarize the information by selecting and reporting the main features, and make comparisons where relevant.
Biểu đồ dưới đây cho thấy tỷ lệ sinh viên tốt nghiệp với các trình độ khác nhau đang làm việc tại một công ty kỹ thuật vào năm 1980 và năm 2008. Hãy tóm tắt thông tin bằng cách chọn lọc và báo cáo những đặc điểm chính, đồng thời đưa ra các so sánh khi thích hợp.
1.2. Phân tích đề bài
Dạng bài: Comparative Graphs (biểu đồ so sánh)
Xem thêm: Hướng dẫn các cách diễn đạt Compare and Contrast Task 1
Bài này có 1 số trường so sánh như sau:
- So sánh về thời gian: 1980 vs 2008
- So sánh về chuyên ngành: Arts vs Science
- So sánh về level học: First degree vs Masters vs PhD
Trong bài The IELTS Workshop sẽ cố gắng bao quát được nhiều nhất cả 3 trường so sánh này nhé.
Để dễ nhìn số liệu hơn bạn có thể nhìn vào bảng dưới đây:
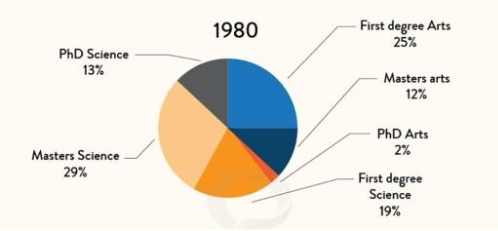
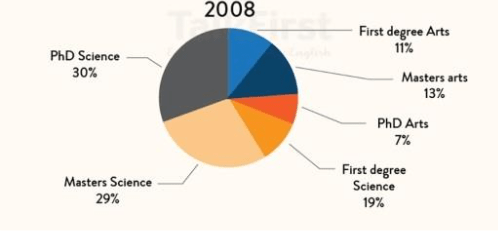
| 1980 | 2008 | |
| First degree Arts | 25% | 11% |
| Masters Arts | 12% | 13% |
| PhD Arts | 2% | 7% |
| First degree Science | 19% | 19% |
| Master Science | 29% | 29% |
| PhD Science | 13% | 30% |
1.3. Dàn bài chi tiết
Overview:
Xét về chuyên ngành: có vẻ công ty về engineering nên nhân viên tốt nghiệp ngành Science chiếm tỉ trọng lớn hơn so với Arts và sự chênh lệch càng rõ rệt hơn trong năm 2008
Xét về level: Có vẻ nhân sự của công ty ngày càng xịn xò ha mọi người. Initially thì công ty chủ yếu employed level First degree và master, tuy nhiên sang đến 2008 thì tỉ trọng PhD tăng lên đáng kể, đặc biệt là PhD Science. Ngược lại thì tỉ trọng First degree Arts sụt giảm đáng kể.
BODY 01: Science degrees
1980: Master chiếm đa số
2008: 2 level thấp hơn (first degree và master) không đổi
Meanwhile, PhD tăng lên đáng kể – trở thành the largest group trong toàn bộ công ty.
BODY 02: Arts degrees
First degree chiếm đa số năm 1980 – đồng thời là second largest group trong công ty, tuy nhiên đến 2008 sụt giảm mạnh.
Ngược lại, PhD, tuy chiếm rất nhỏ trong 1980, đã tăng khá đáng kể trong 2008.
Master gần như không thay đổi.
2. Bài mẫu
The charts compare the proportions of employees holding different academic degrees in an engineering firm across two years: 1980 and 2008.
Overall, the firm witnessed an increasing reliance on staff trained in Science, who consistently outstripped those in Arts throughout the period. While the workforce initially consisted mainly of Bachelor’s and Master’s holders, by 2008, doctoral qualifications—particularly in Science—had expanded markedly, contrasting with the notable decline in Arts Bachelor’s employees. This evolution implies a marked improvement in the academic calibre of the firm’s workforce.
In terms of science specialisations, in 1980, Master’s degree holders made up the largest proportion at 29%, which was almost equal to the total of Bachelor’s graduates (19%) and those with PhDs (13%). After nearly three decades, the proportions of graduates at the two lower levels remained constant, in contrast to the signficant rise of PhD’s degree holders, which reached 30% and formed the largest segment among science specialists. Accordingly, science graduates as a whole came to dominate the firm, comprising nearly 70% of all staff.
For employees with Arts qualifications, the pattern differed considerably. In 1980, undergraduates were dominant, forming 25% of the entire workforce and constituting the second-largest category overall, about double the figure for Master’s holders. Yet by 2008, the share of Bachelor’s holders had plunged to 11%, while Master’s graduates showed only a modest increase to 13%. Meanwhile, PhD holders in Arts, though accounting for only 2% in 1980, expanded markedly to 7% by 2008.
Sample by Nguyen Tuan Ngoc – IELTS Teacher at The IELTS Workshop
3. Từ vựng
- graduates with various qualifications / employees holding different academic degrees / graduates with diverse educational backgrounds
- Master’s graduates / Bachelor’s and PhD holders / those with PhDs
- graduates at the two lower levels
- the science majors / In terms of science specialisations
- science specialists / employees in science discipline/ staff with science backgrounds-qualifications / science-qualified staff
- dominate the firm’s total workforce / formed the largest segment of science majors / becoming the predominant category within science.
- almost equal to the total of / a figure roughly equivalent to the combined proportions of
Tạm kết
Hy vọng bài mẫu IELTS Writing Task 1 với chủ đề The proportion of graduates with different qualifications do thầy Nguyễn Tuấn Ngọc biên soạn đã giúp bạn hình dung rõ cách tiếp cận và triển khai một bài IELTS Writing Task 1.
Tham khảo thêm tài liệu sau để nâng cao trình độ tiếng anh của mình: [Cập nhật liên tục] Tổng hợp đề thi IELTS Writing 2025 kèm bài mẫu và Bài mẫu Writing Task 1 trên website. Đây là nguồn tài liệu hữu ích để bạn luyện kỹ năng mô tả số liệu, rèn khả năng so sánh và nắm bắt xu hướng trong biểu đồ.
Ngoài ra, đừng bỏ lỡ khóa HỌC IELTS MIỄN PHÍ trên website – cơ hội để học trực tiếp cùng giảng viên giàu kinh nghiệm và nhận hướng dẫn chi tiết cho từng dạng đề. Đăng ký ngay để nâng cao kỹ năng Writing của bạn một cách hiệu quả nhất!