Bài mẫu với chủ đề long term international migrations in the UK from 1999 to 2008 dưới sự hướng dẫn của thầy Phạm Duy Anh sẽ giúp người học hiểu rõ cách tổ chức ý tưởng và trình bày số liệu trong một bài IELTS Writing Task 1 theo chuẩn học thuật.
1. Phân tích và hướng dẫn
1.1. Đề bài
The chart below shows long term international migrations in the UK from 1999 to 2008. Summarise the information by selecting and reporting the main features, and make comparisons where relevant.
(Biểu đồ dưới đây thể hiện tình hình di cư quốc tế dài hạn tại Vương quốc Anh từ năm 1999 đến năm 2008. Hãy tóm tắt thông tin bằng cách lựa chọn và trình bày những đặc điểm chính, đồng thời đưa ra những so sánh khi phù hợp.)
1.2. Phân tích đề bài
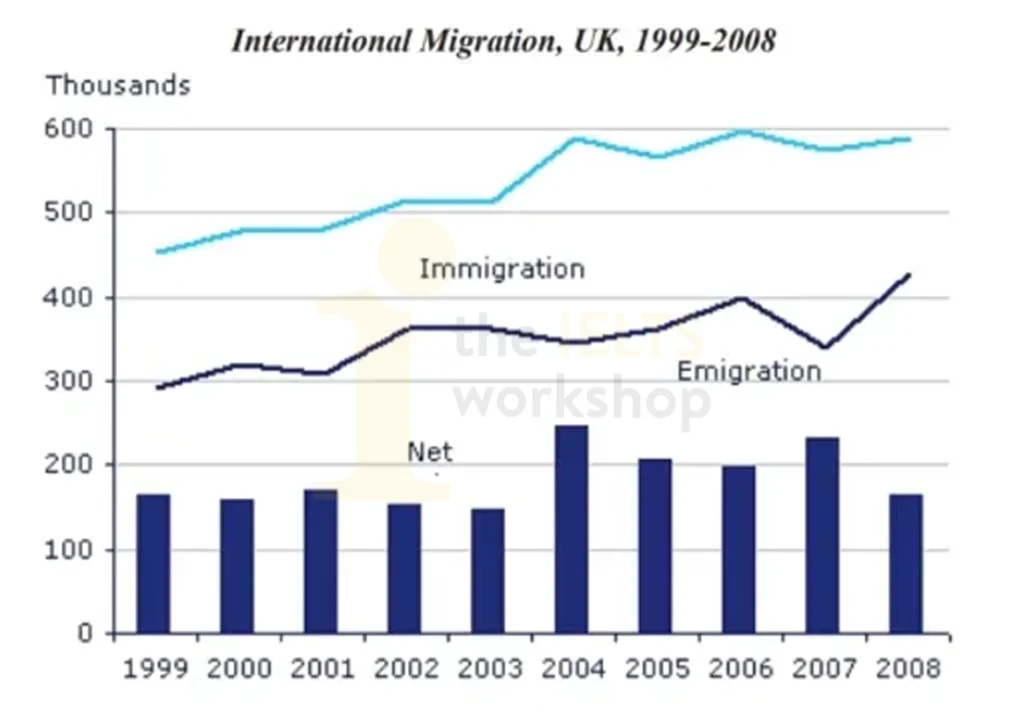
- Loại: Dynamic Chart (Line Graph + Bar Chart)
- Chủ đề: Số liệu xuất nhập cư ở Anh Quốc và độ chênh lệch 2 nhóm thống kê từ năm 1999 đến 2008
- Từ khóa: Immigration; Emigration; Net
- Đơn vị: nghìn người
Xem thêm: Hướng dẫn cách viết Dynamic chart
1.3. Dàn bài chi tiết
- Mở bài: Paraphrase chủ đề
- Tổng quan:
- Nhập cư có số liệu cao hơn xuất cư
- Xu hướng: Tăng đều, với ngoại lệ 1 số giảm sút và lên xuống hỗn loạn
- Thân bài:
- Thân bài 1: Immigration
- Năm 1999-2004: Tăng đều từ 450 nghìn đến gần 600 nghìn người
- Năm 2004-2008: Biến thiên giữa 550-600 nghìn người
- Thân bài 2: Emigration
- Năm 1999-2006: Tăng dần đều từ 300 đến 400 nghìn người
- Năm 2007: Giảm xuống 350 nghìn người
- Năm 2008: Tăng mạnh lên trên 400 nghìn người
- Net difference rates
- Giữ cân bằng, nhưng tỉ lệ năm 1999-2003 thấp hơn so với 2004 đến 2008
- Đặc biệt, tỉ lệ năm 2004 và 2007 cao vọt
- Thân bài 1: Immigration
2. Bài mẫu
The chart documents the numbers of international relocations, including moving in and out of Britain (represented via a line graph), as well as the net difference between both figures (represented via a bar chart) from 1999 to 2008.
Overall, despite some pitfalls, international migration had experienced consistent growth across 10 years, with immigration reporting generally higher numbers than emigration. Evidently, immigration numbers remained superior to emigration, and a spike of net migration numbers in specific years from a mostly balanced net rate was identified.
The number of people moving into the UK witnessed a progressive upwards trend, beginning from 1999 with roughly 450 thousand immigrants, and gradually rose to nearly 600 thousand in 2004. Towards 2008, the numbers fluctuated between approximately 550 to 600 thousand, having never managed to break through over 600 thousand.
Compared to immigration rates, the number of people exiting Britain was consistently lower. Beginning at 300 thousand in 1999, the figures similarly underwent a gradual increase towards 400 thousand emigrants in 2006. Despite dropping to roughly 340 thousand from a pitfall in 2007, the numbers bounced back and surged over 400 thousand in 2008.
Looking at the net rates, while the overall rates were relatively balanced, it is evident that the numbers circa 1999-2003 were lower than the net rates from 2004 to 2008. From 1999 to 2003, the net rates remained relatively constant, ranging between 150-160 thousand individuals. However, in 2004, a surprising spike was documented at 250 thousand, and a similar yet less noted spike at 220 thousand was found in 2007. Aside from those, the years 2005 and 2006, while higher than the 1999-2003 period, remained stable, and the net number fell below 200 thousand migrants in 2008.
Sample by Pham Duy Anh – IELTS Teacher at The IELTS Workshop
3. Từ vựng
- Immigration (n): nhập cư = entering a country for potentially permanent residence
- Emigration (n): xuất cư = exiting a country for potentially permanent residence in another country
- Consistent (adj): nhất quán, đồng đều = steady; stable; gradual; progressive
- Superior (adj): vượt trội hơn = higher; taller; supersede; triumphant
- Spike (n): tăng vọt; tăng bất ngờ = sharp increase; surge; skyrocket
Tạm kết
Thông qua việc phân tích bài mẫu The chart below shows long term international migrations in the UK from 1999 to 2008, người học có thể rèn luyện kỹ năng mô tả xu hướng và so sánh số liệu một cách logic và hiệu quả của dạng biểu đồ động (Dynamic Chart).
Tham khảo tài liệu sau: [Cập nhật liên tục] Tổng hợp đề thi IELTS Writing kèm bài mẫu và Bài mẫu Writing Task 1 trên website. Đây là nguồn tài liệu hữu ích để bạn luyện kỹ năng mô tả số liệu, rèn khả năng so sánh và nắm bắt xu hướng trong biểu đồ từ đó nâng cao hơn band điểm của mình.
Ngoài ra, đừng quên tham khảo HỌC IELTS MIỄN PHÍ trên website để có cơ hội học trực tiếp cùng giảng viên giàu kinh nghiệm giảng dạy để nắm rõ các kĩ năng làm các dạng bài IELTS.