Bài mẫu với chủ đề The changes in the UK industry steel between 1970 and 2000, được xây dựng dưới sự hướng dẫn của thầy Nguyễn Tuấn Ngọc, sẽ hỗ trợ người học nắm vững cách triển khai ý tưởng, mô tả xu hướng và so sánh dữ liệu một cách rõ ràng, từ đó hoàn thiện một bài IELTS Writing Task 1 đầy đủ và hiệu quả.
1. Phân tích và hướng dẫn
1.1. Đề bài
The graphs show the changes in the UK industry steel between 1970 and 2000. (million tonnes vs thousand)
(Các biểu đồ cho thấy sự thay đổi của ngành công nghiệp thép tại Vương quốc Anh trong giai đoạn từ năm 1970 đến năm 2000, với số liệu được thể hiện theo đơn vị triệu tấn và nghìn (người/đơn vị).)
1.2. Phân tích đề bài
- Dạng bài: Mixed chart – Line chart – Dynamic (biến đổi số liệu theo thời gian)
- Phân tích yêu cầu đề bài: Với dạng bài này, chúng ta cần highlight được xu hướng của các line theo các mốc thời gian, đồng thời so sánh sự tương quan giữa các lines.
Xem thêm: Hướng dẫn chi tiết cách viết Mixed Chart
1.3. Dàn bài chi tiết
Overview: Main trends
– Overall decline in demand;
– Shift from domestic production to imports;
– Sharp fall in employment
Body 1: Demand & supply trends
– Demand peaked in 1970 then fell and stabilised;
– Domestic production declined sharply;
– Imports increased steadily and matched local output by 2000
Body 2: Employment
– Workforce was highest in 1970;
– Numbers dropped sharply by 1990;
– Continued to fall slightly afterwards
2. Bài mẫu
The two line charts illustrate changes in the UK steel industry between 1970 and 2000, focusing on the relative contribution of domestic production and imports, and employment levels within the sector.
Overall, the UK steel industry experienced a marked long-term contraction. Total demand declined substantially over the period, while domestic production fell sharply and was gradually overtaken by imported steel. This structural shift in supply was accompanied by a dramatic reduction in employment, particularly during the last decade.
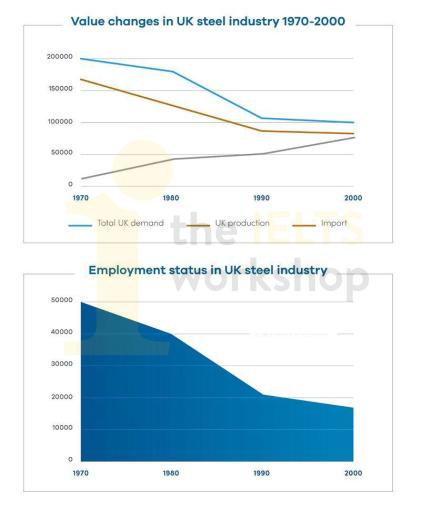
Looking first at the value of the steel industry in the UK over the period from 1970 to 2000, it is notable that the market was at its peak in 1970, with demand standing at 200,000 million tons, the majority of which was sourced from local production (170,000 million tons). Total demand for steel then witnessed a substantial decline, falling by half over the following 20 years to approximately 100,000 million tons in 1990, after which it remained stable at this level until the end of the period.
A corresponding fall was observed in local steel output, which dropped sharply to below 90,000 million tons in 1990, followed by a negligible decline over the final 10 years. Meanwhile, the volume of imported steel increased steadily throughout the 30-year period. Specifically, the UK purchased only around 10,000 million tons of steel from foreign manufacturers in 1970, but this figure rose considerably to reach a peak of approximately 70,000 million tons by 2000, closely matching the level of domestic production.
Employment patterns closely mirrored these developments. The UK steel industry initially employed 50,000 workers in 1970, the highest figure recorded during the period. The workforce then shrank dramatically, reflecting the significant decline in domestic steel production, and by 1990, only 20,000 people were employed in the industry, a figure less than half of the original level. Over the final decade, employment continued to fall, albeit at a slower pace, ending the period at roughly 18,000 workers.
Sample by Nguyen Tuan Ngoc – IELTS Teacher at The IELTS Workshop
3. Từ vựng
- the relative contribution of domestic production and imports
→ tỷ trọng / mức đóng góp tương đối của sản xuất trong nước và hàng nhập khẩu - experienced a marked long-term contraction
→ trải qua sự suy giảm rõ rệt trong dài hạn - was gradually overtaken by imported steel
→ dần dần bị thép nhập khẩu vượt qua / chiếm ưu thế - A corresponding fall was observed
→ một sự sụt giảm tương ứng đã được ghi nhận
- Employment patterns closely mirrored these developments
→ xu hướng việc làm phản ánh rất sát những diễn biến này
Tạm kết
Sau khi tham khảo bài mẫu, người học sẽ hiểu rõ hơn cách phân tích số liệu và tổ chức nội dung trong một bài IELTS Writing Task 1 dạng Mixed chart theo đúng bố cục chuẩn. Hãy dành thời gian nghiên cứu kỹ phần hướng dẫn của thầy Nguyễn Tuấn Ngọc và ghi lại những ý chính quan trọng để từng bước cải thiện và nâng cao kỹ năng viết học thuật của mình.
Tham khảo tài liệu sau: [Cập nhật liên tục] Tổng hợp đề thi IELTS Writing kèm bài mẫu và Bài mẫu Writing Task 1 trên website. Đây là nguồn tài liệu hữu ích để bạn luyện kỹ năng mô tả số liệu, rèn khả năng so sánh và nắm bắt xu hướng trong biểu đồ từ đó nâng cao hơn band điểm của mình.
Ngoài ra, đừng quên tham khảo HỌC IELTS MIỄN PHÍ trên website để có cơ hội học trực tiếp cùng giảng viên giàu kinh nghiệm giảng dạy để nắm rõ các kĩ năng làm các dạng bài IELTS.