Bài viết sau, cô Phạm Thị Thu Hà sẽ hướng dẫn bạn làm bài Writing Task 1 chủ đề The population aged 65 and above in three countries. Bài viết sẽ giúp bạn triển khai ý tưởng một cách chặt chẽ, khoa học và logic hơn.
1. Phân tích và hướng dẫn
1.1. Đề bài
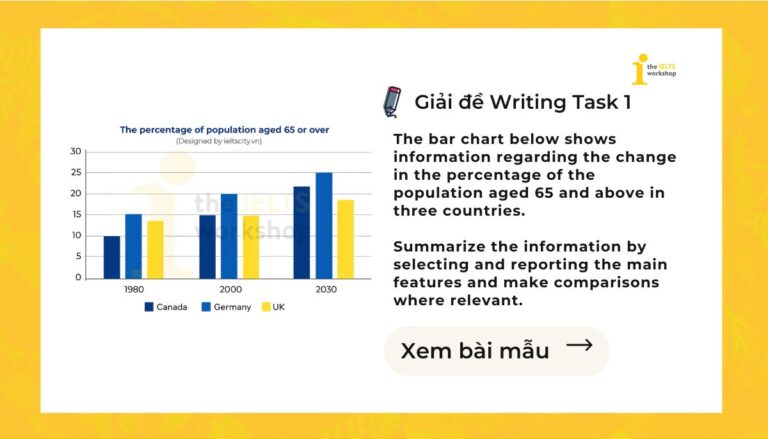
The bar chart below shows information regarding the change in the percentage of the population aged 65 and above in three countries. Summarize the information by selecting and reporting the main features and make comparisons where relevant.
(Biểu đồ cột dưới đây cung cấp thông tin về sự thay đổi trong tỷ lệ dân số từ 65 tuổi trở lên ở ba quốc gia. Hãy tóm tắt thông tin bằng cách lựa chọn và trình bày những đặc điểm chính, đồng thời đưa ra những so sánh khi thích hợp.)
1.2. Phân tích đề bài
Dạng bài: Bar charts
Phân tích đề bài:
- Countries: Canada, Germany, the UK
- Years: 1980, 2000, 2030
- Unit: percentage (%)
- Topic: population aged 65 and over
Lưu ý: Vì 2030 là một mốc trong tương lai, khi viết nên dùng các cách diễn đạt như is projected to/ is expected to/ is predicted to thay vì chỉ dùng quá khứ đơn như các bài thông thường.
Xem thêm: Các bước làm bài IELTS Writing Task 1 Bar Chart bạn cần phải biết
1.3. Dàn bài chi tiết
Intro: Paraphrase đề bài.
The bar chart compares the proportion of the population aged 65 and over in Canada, Germany and the UK in 1980 and 2000, with a projection for 2030.
Overview: Ở bài này dễ dàng nhận thấy hai điểm nổi bật chính:
- General trend: Tỷ lệ người già trên 65 đều tăng ở tất cả các nước
- Ranking: Trong số các nước đã cho, Germany có tỷ lệ dân số già cao hơn hai nước còn lại ở cả 3 năm.
What is most striking about the chart is the expansion of this demographic group across all three countries. Notably, Germany consistently recorded the highest proportion of people aged 65 and over throughout the period.
Body Paragraph 1: (1980 – 2000): So sánh về ranking và tốc độ tăng giữa ba nước
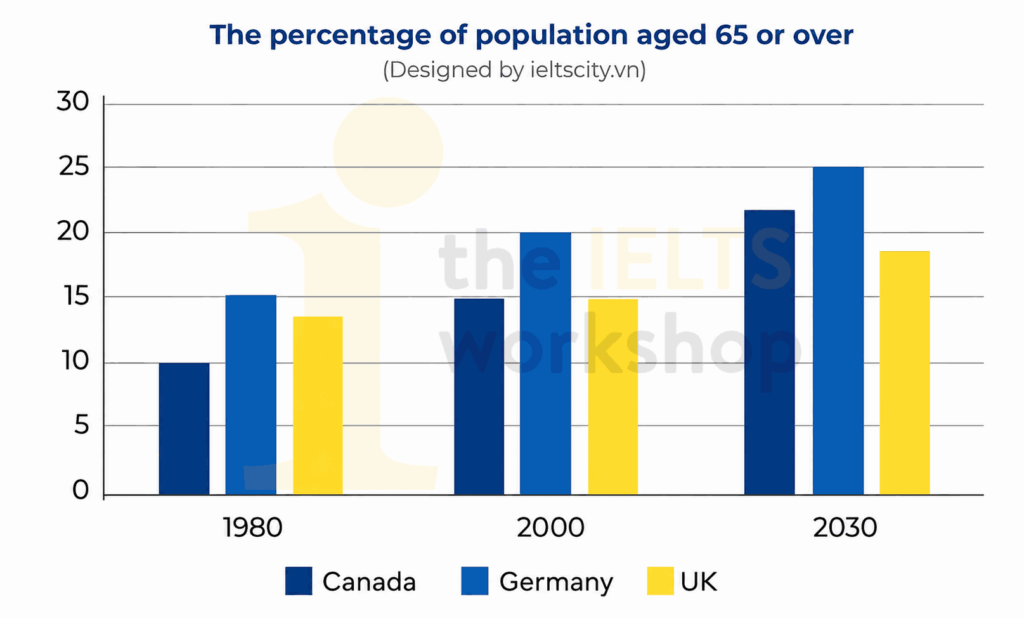
- 1980: Germany: 15% > Canada: 10% và The UK: around 13%
- 2000: Canada và Germany cùng tăng 5 percentage points, trong khi tốc độ tăng của UK chậm hơn (khoảng 2 percentage points). Khoảng cách biến mất, lúc đầu the UK lớn hơn Canada nhưng bây giờ đã bằng nhau. Số liệu của Germany vẫn luôn cao nhất.
Body Paragraph 2: So sánh về ranking và tốc độ tăng giữa ba nước
- Germany: tiếp tục tăng vs tốc độ tương tự, đạt 25%
- Canada: tăng với tốc độ đáng kể nhất, đạt khoảng 22% à vượt UK
- UK: tốc độ tăng chậm nhất à số liệu cuối cùng thấp nhất (17%)
2. Bài mẫu
The bar chart compares the proportion of the population aged 65 and over in Canada, Germany and the UK in 1980 and 2000, with a projection for 2030.
What is most striking about the chart is the expansion of this demographic group across all three countries. Notably, Germany consistently recorded the highest proportion of people aged 65 and over throughout the period.
In 1980, Germany had the largest percentage of people aged 65 and over at 15%, which Canada and the UK trailed behind with approximately 10% and 13%, respectively. By 2000, there had been a rise of 5 percentage points in the proportions recorded in Germany and Canada, pushing their figures to 20% and 15%, in that order. However, the growth observed in the UK was less pronounced, with its figure increasing only moderately to 15%. As a result, the gap between Canada and the UK had disappeared, with both countries recording the same proportion, although their figures remained below Germany’s.
Looking ahead to 2030, Germany is predicted to continue its consistent upward trajectory to 25%, still maintaining its dominance as the country with the highest proportion of elderly people. Meanwhile, according to projections, Canada will exhibit the most substantial rise to around 22% and overtake the UK. In contrast, the percentage of individuals aged 65 and above in the UK is expected to end at just 17%, leaving it as the country with the lowest figure.
Sample by Pham Thi Thu Ha – IELTS Teacher at The IELTS Workshop
3. Từ vựng
- demographic group: nhóm dân số, nhóm nhân khẩu học
- trail behind: đứng sau, thấp hơn so với
- less pronounced: ít rõ rệt hơn, ít đáng kể hơn
- upward trajectory: xu hướng tăng, đà tăng
- exhibit the most substantial rise: ghi nhận mức tăng đáng kể nhất
Tạm kết
Hy vọng rằng sau khi tham khảo bài mẫu chủ đề The population aged 65 and above in three countries trên học viên sẽ hiểu rõ hơn cách triển khai và hoàn thiện một bài IELTS Writing Task 1 dạng Bar Chart một cách đầy đủ.
Tham khảo tài liệu: [Cập nhật liên tục] Tổng hợp đề thi IELTS Writing 2026 kèm bài mẫu và Bài mẫu Writing Task 1 trên website. Đây là nguồn tài liệu hữu ích để bạn luyện kỹ năng mô tả số liệu, rèn khả năng so sánh và nắm bắt xu hướng trong biểu đồ từ đó nâng cao hơn band điểm của mình.
Tham khảo ngay khóa HỌC IELTS MIỄN PHÍ trên website để có cơ hội học trực tiếp cùng giảng viên giàu kinh nghiệm giảng dạy để nắm rõ các kĩ năng làm các dạng bài IELTS.