Dưới đây là bài mẫu chủ đề A survey of library users at a university do thầy Vũ Văn Khoa hướng dẫn. Bài viết sẽ giúp bạn hiểu và triển khai dạng bài IELTS Writing Task 1 một cách đơn giản, khoa học và hiệu quả hơn nhé!
1. Phân tích và hướng dẫn
1.1. Đề bài
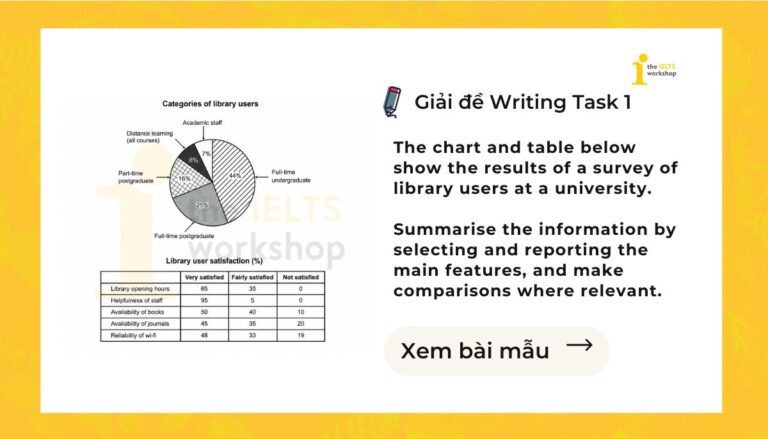
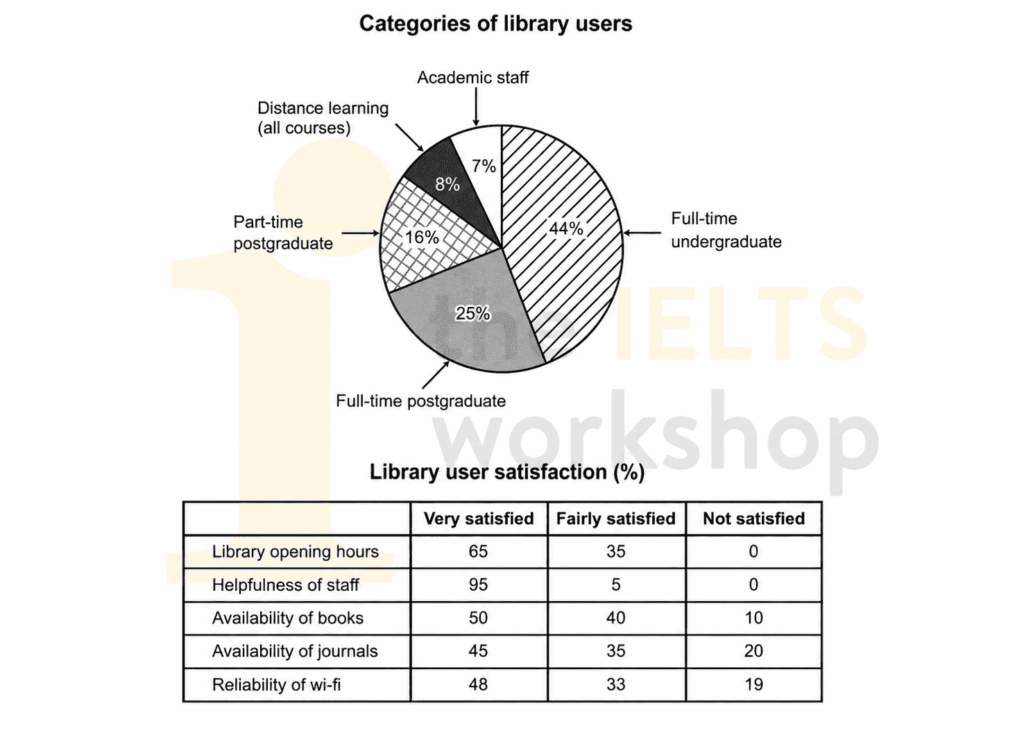
The chart and table below show the results of a survey of library users at a university. Summarise the information by selecting and reporting the main features, and make comparisons where relevant.
(Biểu đồ và bảng dưới đây trình bày kết quả khảo sát người sử dụng thư viện tại một trường đại học. Hãy tóm tắt thông tin bằng cách chọn lọc và nêu bật các đặc điểm chính, đồng thời thực hiện so sánh khi thích hợp.)
1.2. Phân tích đề bài
Dạng bài: Mixed charts (Pie chart + Table)
Đây là dạng mixed charts, trong đó pie chart và table cung cấp hai nhóm thông tin khác nhau nhưng cùng xoay quanh chủ đề university library.
Xem thêm: Hướng dẫn chi tiết cách viết Mixed Chart trong IELTS Writing Task 1
1.3. Dàn bài chi tiết
Intro: 1 câu paraphrase hai biểu đồ:
- Pie chart → proportions of different groups of people using the university library.
- Table → levels of satisfaction with different aspects of the library.
- Công thức: The pie chart shows + proportions of X, while the accompanying table compares + levels of satisfaction with Y.
Overview: 2 câu
- Main feature 1: Pie chart
- Full-time undergraduate students = nhóm lớn nhất.
- Academic staff = nhóm nhỏ nhất.
- Main feature 2: Table
- Staff helpfulness = mức độ hài lòng cao nhất.
- Books, journals và internet = comparatively lower satisfaction.
Body 1: Pie chart
- Full-time undergraduates: just under 45%
- Full-time postgraduates: 25%
- Part-time postgraduates: 16%
- Online students: 8%
- Academic staff: 7%
- Full-time undergraduates gần gấp đôi full-time postgraduates.
- Online students và academic staff có tỷ lệ khá tương đồng.
- Hai nhóm nhỏ nhất chỉ chiếm lần lượt 8% và 7%.
Body 2: Table
Có thể chia information thành hai nhóm:
- Nhóm 1: Những yếu tố có mức hài lòng cao
- Opening hours: very satisfied: 65%, quite satisfied: 35%, 0% dissatisfied
- Staff helpfulness: very satisfied: 95%, remaining 5% = quite satisfied, 0% dissatisfied
- Nhóm 2: Những yếu tố có satisfaction thấp hơn
- Books: extremely satisfied: 50%, reasonably satisfied: 40%, dissatisfied: 10%
- Journals: extremely satisfied: ~50%, reasonably satisfied: 35%, dissatisfied: 20%
- Internet/Wi-Fi: extremely satisfied: ~50%, reasonably satisfied: ~35%, dissatisfied: ~20%
2. Bài mẫu
The pie chart shows the proportions of different groups of people who use a university library, while the accompanying table compares their levels of satisfaction with various aspects of the library.
Overall, full-time undergraduates constitute by far the largest user group, whereas academic staff account for the smallest proportion. In terms of satisfaction, library users are particularly positive about the staff’s helpfulness, while access to books, journals and a reliable internet connection receives comparatively lower ratings.
Full-time undergraduate students make up the largest share of library users, at just under 45%, which is almost twice the proportion of full-time postgraduates, at 25%. Part-time postgraduate students represent a further 16%, while those studying online account for 8%. Academic staff comprise the smallest group, at only 7% of all users.
Turning to satisfaction levels, 65% of respondents are very satisfied with the library’s opening hours, with the remaining 35% being quite satisfied. Staff helpfulness receives the most favourable assessment, as 95% of users report being very satisfied and the remaining 5% quite satisfied, with no dissatisfaction recorded. Satisfaction is somewhat lower in relation to the availability of books, journals and the reliability of the internet. Around 50% of users are extremely satisfied with each of these features, while the corresponding figures for those who are reasonably satisfied are 40% for books and approximately 35% for both journals and Wi-Fi. Dissatisfaction is reported by 10% of users regarding book availability and by around 20% in the cases of journals and internet reliability.
Sample by Vu Van Khoa – IELTS Teacher at The IELTS Workshop
3. Từ vựng
- the proportions of (noun phrase): tỷ lệ của
- the accompanying table (noun phrase): bảng biểu đi kèm
- constitute by far the largest (verb phrase): chiếm tỷ lệ lớn nhất cho đến nay
- account for (phrasal verb): chiếm
- make up the largest share of (verb phrase): chiếm phần/tỷ trọng lớn nhất của
- represent a further (verb phrase): chiếm thêm một tỷ lệ là
- the most favourable assessment (noun phrase): đánh giá tích cực nhất
- report being very satisfied with (verb phrase): cho biết rằng rất hài lòng với
- the corresponding figures for (noun phrase): các số liệu tương ứng đối với
- dissatisfaction is reported by (passive structure): sự không hài lòng được ghi nhận ở
Tạm kết
Hy vọng rằng sau khi tham khảo bài mẫu chủ đề A survey of library users at a university trên học viên sẽ hiểu rõ hơn cách triển khai và hoàn thiện một bài IELTS Writing Task 1 dạng Mix Chart một cách đầy đủ.
Tham khảo tài liệu: [Cập nhật liên tục] Tổng hợp đề thi IELTS Writing 2026 kèm bài mẫu và Bài mẫu Writing Task 1 trên website. Đây là nguồn tài liệu hữu ích để bạn luyện kỹ năng mô tả số liệu, rèn khả năng so sánh và nắm bắt xu hướng trong biểu đồ từ đó nâng cao hơn band điểm của mình.
Đừng quên tham khảo HỌC IELTS MIỄN PHÍ trên website để có cơ hội học trực tiếp cùng giảng viên giàu kinh nghiệm giảng dạy để nắm rõ các kĩ năng làm các dạng bài IELTS.