
Biểu đồ động (Dynamic chart) là dạng bài xuất hiện trong phần thi IELTS Writing Task 1. Ở bài viết này, The IELTS Workshop sẽ hướng dẫn bạn cách phân tích và viết bài Biểu đồ động – Dynamic chart một cách hiệu quả nhất.
1. Khái niệm Dynamic chart – Biểu đồ động
1.1. Biểu đồ động
Biểu đồ động (Dynamic chart) là biểu đồ chứa dữ liệu có xu hướng thay đổi theo thời gian. Đặc điểm để nhận diện của biểu đồ động là có một khoảng thời gian trong tên của biểu đồ
VD: The annual earnings of three bakeries in Paris, 2010-2020.
1.2. Các loại biểu đồ động
Bạn có thể gặp 4 dạng đồ thị dưới đây trong bài biểu đồ động như:
1.3. Sự khác biệt giữa biểu đồ động và biểu đồ tĩnh:
- Biểu đồ tĩnh (static chart) chỉ thể hiện số liệu trong một khoảng thời gian
- Biểu đồ động (dynamic chart) thể hiện sự so sánh, thay đổi, xu hướng của số liệu trong hai hoặc nhiều khoảng thời gian hơn.
2. Hướng dẫn triển khai dạng bài Biểu đồ động (Dynamic chart) trong IELTS Writing Task 1
Cấu trúc một bài Dynamic chart trong IELTS cũng gồm 4 phần giống như các loại biểu đồ khác.
▸ Introduction: Viết lại đề bài
▸ Overview: Khái quát lại 1, 2 điểm chung
▸ Body 1: Mô tả chi tiết nhóm thông tin 1
▸ Body 2: Viết chi tiết nhóm thông tin 2
Cùng The IELTS Workshop phân tích bài dynamic chart dưới đây để rút ra cách viết Dynamic chart hiệu quả nhé.
2.1. Giới thiệu (Introduction)
Tóm tắt lại đề bài (paraphrase) bằng 1-2 câu, sử dụng ngôn ngữ, cấu trúc của mình. Tránh lặp lại những từ ngữ đã được đề sử dụng. Thông tin cần có:
▸ Loại biểu đồ (line chart)
▸ Khoảng thời gian (no time period)
▸ Nội dung chính của biểu đồ (the average consumption of cheese per person in England, Scotland, Wales and Northern Ireland between 1980 and 2020)
Ví dụ: The line chart depicts information about the amount of cheese that each individual in England, Scotland, Wales, and Northern Ireland consumed on average between 1980 and 2020.
2.2. Tổng quan (Overview)
Phần tổng quan mô tả các đặc điểm nổi bật của biểu đồ. Độ dài lý tưởng của phần Overview là từ 1-2 câu. Có thể nên các đặc điểm về xu hướng như:
▸ Xu hướng chung qua thời gian: tăng hay giảm? dao động liên tục hay giữ nguyên?
▸ Chỉ số cao nhất/thấp nhất là gì?
▸ Khoảng cách giữa các chỉ số
Lưu ý: Không nên nêu hết các đặc điểm và các con số ở phần này vì ta chỉ có 20 phút để viết bài Writing task 1 và số từ bị giới hạn là 150 từ. Do đó, chỉ nêu ra những đặc điểm nổi bật và so sánh.
Ví dụ:
Overall, England’s figures declined by the end of the period as did Scotland’s despite some fluctuations, whereas people in Wales and in Northern Ireland both increased their cheese consumption.
2.3. Thân bài (Body)
Chúng ta có thể viết 2 đoạn thân bài cho dạng biểu đồ này. Trong đó:
▸ Sử dụng phương pháp nhóm thông tin (tìm ra điểm tương đồng và khác biệt của các số liệu trong bảng biểu và nhóm chúng vào với nhau.)
▸ Viết 1 đoạn thân bài về sự khác biệt, 1 đoạn thân bài về sự tương đồng. (Hoặc nếu không tìm thấy sự khác biệt/tương đồng, hãy lần lượt mô tả các số liệu của từng đối tượng.)
▸ Mỗi đoạn dài từ 3-5 câu
Một số lưu ý khi viết phần thân bài:
- Kiểm soát độ dài để tránh bị lố thời gian (chỉ có 20 phút cho task 1). Chỉ chọn ra các đặc điểm nổi bật để viết.
- Không nêu quan điểm cá nhân trong bài.
- Sử dụng các từ linking words trong câu văn và đoạn văn để ăn điểm cohesion.
- Dùng các từ vựng và ngữ pháp phù hợp cho phần thi Writing task 1.
2.4. Các mẫu câu để mở đầu đoạn thân bài:
- As it is presented in the diagram(s)/ graph(s)/ pie chart(s)/ table…
- As (it is) shown in the illustration…
- As can be seen in the…
- As the diagrams suggest…
- According to the…
- Categorically speaking…
- Getting back to the details…
- Now, turning to the details…
- The table data clearly shows that…
- The diagram reveals that…
- The data suggest that…
- The graph gives the figure…
- It is interesting to note that…
- It is apparently seen that…
- It is conspicuous that…
- It is explicitly observed that…
- It is obvious…
- It is clear from the data…
- It is worth noticing that…
- It is crystal clear/ lucid that…
- It can be clearly observed that…
- It could be plainly viewed that…
- It could be noticed that…
- We can see that…
Ví dụ:
As it is presented in the chart, England’s figures fell consistently from roughly 112kg in 1980 to approximately 88kg in 2020. Meanwhile, Scotland started with about 85kg before jumping to roughly 105kg in 1990. From that point, the figures dropped significantly until it was down to approximately 55kg in 2020.
3. Các cụm từ và từ vựng được sử dụng mô tả số liệu trong biểu đồ động – Dynamic chart
3.1. Mô tả sự Tăng lên – Increase
- VERB: rise / increase / go up / uplift / rocket(ed) / climb / upsurge / soar/ shot up/ improve/ jump/ leap/ move upward/ skyrocket/ soar/ surge.
- NOUN: a rise / an increase / an upward trend / a growth / a leap / a jump / an improvement/ a climb.
3.2. Mô tả sự Giảm xuống – Decrease
- VERB: fall / decrease / decline / plummet / plunge / drop / reduce / collapse / dip / dive / go down / take a nosedive / slum / slide / go into free-fall.
- NOUN: a fall / a decrease / a reduction / a downward trend /a downward tendency / a decline/ a drop / a slide / a collapse / a downfall.
3.3. Mô tả sự Bình ổn – Steadniess
- VERB: Stay unchanged / level out / remain constant / remain steady / plateau / remain the same / remain stable / remain static
- NOUN: a steadiness/ a plateau / a stability/ a static
3.3. Mô tả sự Thay đổi lớn, nhanh, rõ rệt – Rapid change
- ADVERB: dramatically / rapidly / sharply / quickly / hurriedly / speedily / swiftly / significantly/ considerably / substantially / noticeably.
- ADJECTIVE: dramatic / rapid / sharp / quick / hurried / speedy / swift / significant / considerable / substantial / noticeable.
3.4. Mô tả sự Thay đổi ở mức trung bình – Moderate change
- ADVERB: moderately / gradually / progressively / sequentially
- ADJECTIVE: moderate / gradual / progressive / sequential
3.5. Mô tả sự Thay đổi đều, thay đổi ổn định – Steady change
- ADVERB: steadily/ ceaselessly
- ADJECTIVE: steady/ ceaseless
3.6. Mô tả sự Thay đổi nhỏ – Slight change
- ADVERB: slightly / slowly / mildly / tediously
- ADJECTIVE: slight / slow / mild / tedious
Lưu ý: Các động từ mô tả sự thay đổi, như tăng vọt (soar) hoặc giảm mạnh (plummet) không cần trạng từ, vì chúng ta đã biết rằng chúng mô tả một sự thay đổi lớn. Tuy nhiên, tất cả các động từ còn lại đều cần một trạng từ, để cho người đọc biết bạn đang nói về loại tăng hoặc giảm nào.
4. Dàn bài mẫu của Dynamic chart
4.1. Introduction
The line/bar/pie chart(s)/table(s)
+ show(s) / exhibit(s) / give(s) information about / compare + how many ___ (the number of) / how much ___ (the amount of)
+ over a __-year period between ___ and ___ / between ___ and ___ / over ___ years / over the course of ___ years starting in ___.
4.2. Overview
[Overall / From an overall perspective] +
Major trend:
+ there (be) an upward/increase trend in ____ / ____ see(s)/saw an upward/increase trend
+ there (be) a downward/decrease trend in ____/ ____ see(s)/saw a downward/decrease trend
+ there (be) a fluctuant trend in ____ / ____ illustrate(s) a wave-like movement
Outstanding features:
Highest/lowest:
* _____ (be) the most/least popular /
* _____ experience(s/d) the highest/lowest figure.
Others:
* The percentage/proportion/number/… of ____ + in ___ + double(s/d) / (be) 3, 4, 5, … times higher/less than + the figure of that of ____
(e.g. The number of tourists in New York was three times higher than that of Canada.)
* A new category of ____ (be) shown / appear(s/ed) in the chart for (year).
4.3. Body 1
Sentence 1
Looking at the details, the number/ratio/percentage… of ____ start(s/ed) / stand(s) / stood at ____ in (year), and then rise(s/rose) / decline(s/d) to reach the highest/lowest point of ___ in (year).
Sentence 2:
In (year), the figure dip(ped/s) / fall(fell) down significantly / soar(ed/s) / grew considerably to ____.
| Sentence 3 | A similar/contrastive trend (be) recorded in _____ during the period, which goes(went) up / down by ___ from the (year) figure of ___. (e.g. A similar trend was recorded in the number of tourists in Canada during the period, which went up by 5% from the 2005 figure of 15%.) | On the other hand/Besides, _____ begin(s/began) at ____ in (year), after that it rise(s/rose) / reduce(s/d) noticeably/slightly in (year) at ____. (e.g. On the other hand, LaGuardia began at 35m in 1995, after that it rose remarkably for the next three years, at 46m.) |
| Sentence 4 | ____ was the number/proportion of ____ in (year). | In (year), ____ hit(s) the peak/highest point / reach(es/ed) a bottom at ___. |
4.4. Body 2
Sentence 1
The ___ year period witness(es/ed) a ___ climb/fall in the ___, which is(was) ___ in (year 1) and ___ in (year 2).
hoặc If we look at ____, it start(s/ed) at ____ in the first year.
Sentence 2
In (year), the figure peak(s/ed) at ____.
hoặc After this point, the trend jump(s/ed) / go(went) down to ____ in (year).
Sentence 3 (if any)
In the last ___ years, the trend remained stable at ____.
hoặc In the last ___ years, there (be) a wild/mild fluctuation in ___, with the highest and lowest ratio/number shown in (year) at ____ and (year) at ____ respectively.
Xem thêm cách làm các dạng IELTS Writing Task 1:
- Cách viết Process/Diagram IELTS Writing Task 1
- Hướng dẫn cách viết dạng bài Line Graph IELTS Writing Task 1
- Các bước làm dạng bài Map trong IELTS Writing Task 1
5. Một số lỗi thường gặp khi viết Dynamic chart
- Sao chép toàn bộ đề bài vào bài làm mà không viết lại (paraphrase) bằng ngôn ngữ và từ vựng của bạn
- Không xuống dòng với mỗi đoạn văn khác nhau
- Không viết phần overview / summary cho các thông tin trong bảng biểu. Overview / summary phải được viết ngay sau câu mở đầu, và chỉ tóm tắt trong 1-2 câu.
- Không mô tả các đối tượng tách biệt nhau. Luôn nhớ so sánh các đối tượng với nhau nếu như số liệu có sự liên quan để so sánh.
- Mô tả toàn bộ các con số trong bảng biểu (trừ khi bảng biểu chỉ có 1 vài con số). Kỹ năng quan trọng trong Writing Task 1 là việc thí sinh biết cách lựa chọn thông tin chính và mô tả, so sánh chúng khi có sự liên quan / xu hướng. Cố gắng đảm bảo đề cập đến 5-7 con số trong 1 đoạn văn.
- Dành hơn 20 phút cho bài Task 1.
- Thêm “s” sau million, thousand, billion khi miêu tả số liệu.
Ví dụ: Cách viết sai: 7 millions people. Cách viết đúng: 7 million people. - Sử dụng sai thì: Đa số mọi người đều dùng quá khứ đơn trong bài viết IELTS Writing Task 1, tuy nhiên sẽ có những trường hợp ngoại lệ. Vậy nên, cần đọc kĩ biểu đồ. Nếu biểu đồ ở thời gian trong quá khứ thì dùng Quá khứ đơn. Nếu biểu đồ thời gian ở tương lai thì dùng cấu trúc miêu tả dự đoán (is expected, is estimated).
6. Bài tập Dynamic chart
Hãy tập mô tả các Dynamic chart dưới đây:
Bài mẫu 1:
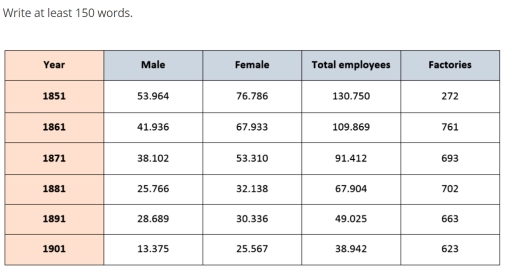
The table illustrates the proportion of factory staff and factories in England and Wales over 50 years from 1851 to 1901.
Overall, the table indicates that the total number of employees witnessed a significant drop throughout the whole period, whereas the number of factories increased substantially over the fifty year timeframe.
Regarding employee numbers, male factory staff in 1851 comprised 287,100 compared to 190,000 females. The figure declined rapidly for males in the years after 1851 dropping to a low of 31,000 in 1901. Figures in the female category also witnessed a sharp decline dropping to 160,000 in 1861, which was more than that of male workers at the time. By 1901 female employee numbers were almost equal to males at 30,000. In total, the workforce figure plummeted from 477,100 in 1851 to 61,000 by 1901.
Looking at the data for factories, these accounted for 225 in 1851. Then the figure jumped sharply after 1861, peaking at 721 factories by 1881. In the following 20 years numbers dropped slightly, totalling 600 factories by 1901.
Bài mẫu 2
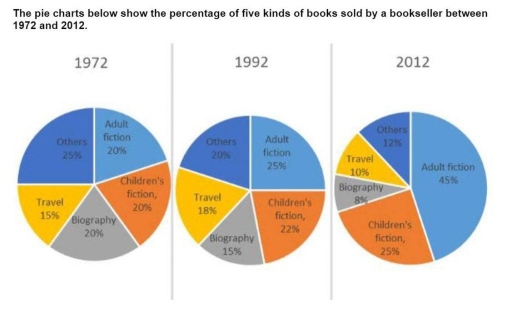
The pie charts detail sales by a bookseller between 1972 and 2012 according to genre. Looking from an overall perspective, it is readily apparent that adult fiction became by far the most popular type at the expense of the genres which declined in popularity (others, biography, and travel). Interest in children’s fiction also increased.
In 1972, this particular bookseller sold relatively equal proportions of each type with others leading at 25%, followed by adult fiction, children’s fiction, and biography all at 20%, and travel lowest at 15%. By 1992, adult fiction had risen by 5%, while others and biography declined by the same number. Travel and children’s fiction grew by 3% and 2%, respectively.
In the final year surveyed, adult fiction surged to 45% and children’s fiction ticked up slightly to 25%. The rise of adult fiction was compensated for by dramatic drops for the remaining genres with others finishing at 12%, travel at 10%, and biography 8%.
Bài mẫu 3
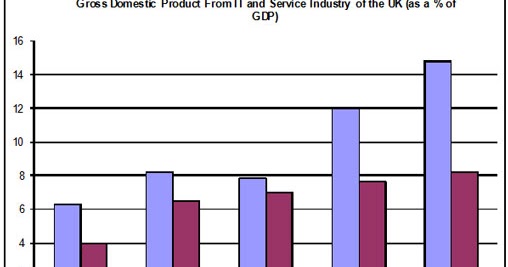
The bar chart illustrates the gross domestic product generated from the IT and Service Industry in the UK from 1992 to 2000. It is measured in percentages. Overall, it can be seen that both increased as a percentage of GDP, but IT remained at a higher rate throughout this time.
At the beginning of the period, in 1992, the Service Industry accounted for 4 percent of GDP, whereas IT exceeded this, at just over 6 per cent. Over the next four years, the levels became more similar, with both components standing between 6 and just over 8 per cent. IT was still higher overall, though it dropped slightly from 1994 to 1996.
However, over the following four years, the patterns of the two components were noticeably different. The percentage of GDP from IT increased quite sharply to 12 in 1998 and then nearly 15 in 2000, while the Service Industry stayed nearly the same, increasing to only 8 per cent.
At the end of the period, the percentage of GDP from IT was almost twice that of the Service Industry.
Các bạn cũng có thể theo dõi bài giảng miễn phí về Hướng dẫn cách viết dạng Dynamic chart trong IELTS Writing Task 1 tại đây nhé. Bài giảng được biên soạn bởi đội ngũ giáo viên IELTS 8.5, 9.0 tại The IELTS Workshop.
Với các bước chinh phục bài IELTS Writing Task 1 Dynamic Chart ở trên, dạng bài này chắc chắn trở nên dễ dàng hơn với bạn. Bạn có thể đọc thêm chiến thuật làm các dạng bài Writing Task 1 khác của The IELTS Workshop cũng như phương pháp làm bài tại khóa học Pre-Senior 6.0+ IELTS nhé.

![[PDF] Review trọn bộ sách IELTS Writing Journey band 6.0 – 8.0](https://onthiielts.com.vn/wp-content/uploads/2026/03/IELTS-Writing-Journey-300x169.jpg)

![[Cập nhật liên tục] Tổng hợp đề thi IELTS Writing 2026 kèm bài mẫu](https://onthiielts.com.vn/wp-content/uploads/2026/01/tong-hop-de-thi-2026-1-1-300x169.jpg)