
Bạn là người mới bắt đầu học IELTS và đang cảm thấy hoang mang trước những dạng biểu đồ phức tạp trong phần thi IELTS Writing Task 1? Đừng lo lắng! Hãy cùng The IELTS Workshop giải mã toàn bộ về IELTS Writing Task 1 và tham khảo kho bài mẫu IELTS Writing Task 1 Band 9 theo từng dạng bài nhé.
1. Tổng quan về IELTS Writing Task 1
IELTS Writing Task 1 là phần thi đầu tiên của bài thi IELTS Writing, yêu cầu bạn mô tả, tóm tắt hoặc giải thích một biểu đồ, bảng số liệu, bản đồ hoặc quy trình bằng ngôn ngữ của chính mình.
- Thời gian làm bài khuyến nghị: 20 phút
- Độ dài: Tối thiểu 150 từ
- Trọng số điểm: Chiếm ⅓ tổng số điểm của bài thi IELTS Writing.
- Lưu ý: Người làm bài thi chỉ mô tả lại khách quan theo yêu cầu đề bài. Tuyệt đối không đưa quan điểm cá nhân vào bài viết.
Tiêu chí chấm điểm:
- Task Achievement: Trả lời đúng, đủ yêu cầu đề bài; có phần tổng quan (Overview) rõ ràng và chọn lọc được các số liệu nổi bật.
- Coherence and Cohesion: Sự mạch lạc và tính liên kết giữa các câu, các đoạn thông qua việc sử dụng từ nối.
- Lexical Resource: Sự đa dạng và chính xác của từ vựng, đặc biệt là các cấu trúc mô tả xu hướng và so sánh.
- Grammatical Range and Accuracy: Sự linh hoạt và chính xác của cấu trúc ngữ pháp, sử dụng đan xen câu đơn, câu ghép, câu phức.
2. Cấu trúc của một bài IELTS Writing Task 1
Một bài IELTS Writing Task 1 tiêu chuẩn sẽ đáp ứng cấu trúc như sau:
| Cấu trúc | Nội dung | Độ dài |
| 1. Introduction (Mở bài) | Paraphrase đề bài | 1 câu |
| 2. Overview (Tổng quan) | Nêu ra 2 – 3 đặc điểm nổi bật nhất của biểu đồ Lưu ý: Không đưa số liệu cụ thể vào đây. | 1 – 2 câu |
| 3. Body 1 (Thân bài 1) | Nhóm các đối tượng có cùng đặc điểm, xu hướng để mô tả chi tiết, so sánh và trích dẫn số liệu cụ thể (năm, phần trăm, số lượng…). | 3 – 5 câu |
| 4. Body 2 (Thân bài 2) | Mô tả nhóm đối tượng còn lại, tiếp tục so sánh và đưa số liệu để làm rõ. | 3 – 5 câu |
3. Bài mẫu IELTS Writing Task 1 Band 9 theo từng dạng bài
Dưới đây là tổng hợp đề bài và bài mẫu Band 9 giúp bạn nắm được cách triển khai theo từng dạng bài.
3.1. Dạng bài Line graph (Biểu đồ đường)
Biểu đồ đường là dạng bài thường gặp nhất, tập trung vào việc mô tả xu hướng thay đổi của các đối tượng theo thời gian.
Đề bài:
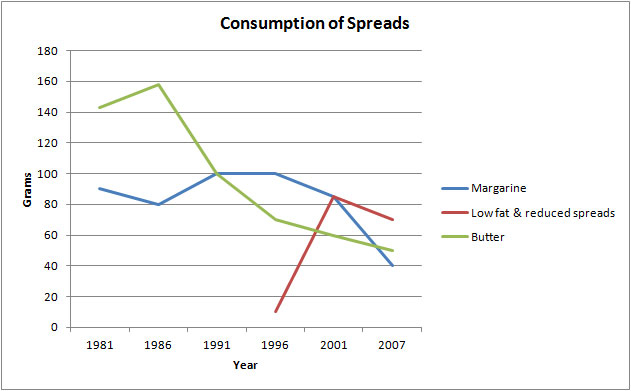
The graph below shows the consumption of three spreads from 1981 to 2007.
Bài mẫu band 9 (Nguồn: IELTS Liz):
The line graph illustrates the amount of three kinds of spreads (margarine, butter, and low fat and reduced spreads) which were consumed from 1981 to 2007. Units are measured in grams.
Overall, the consumption of margarine and butter decreased over the period given, while for low fat and reduced spreads, it rose. At the start of the period, butter was the most popular spread. Margarine was the most widely consumed in the middle of the period but, by the end, low fat and reduced spreads was most popular.
With regards to the amount of butter used, it began at around 140 grams and then peaked at 160 grams in 1980 before falling dramatically to about SO grams in the last year. Likewise, approximately 90 grams of margarine was eaten in the first year, after which the figure fluctuated slightly and dropped to a low of 40 grams in 2007.
On the other hand, the consumption of low fats and reduced spreads only started in 1996 at about 10 grams. This figure, which reached a high of just over 80 grams five years later, fell slightly in the final years to approximately 70 grams in 2007.
Xem thêm: Hướng dẫn cách viết dạng bài Line Graph IELTS Writing Task 1
3.2. Dạng bài Bar chart (Biểu đồ cột)
Biểu đồ cột có thể biểu diễn số liệu theo thời gian có xu hướng hoặc số liệu tĩnh tại một mốc thời gian.
Đề bài:
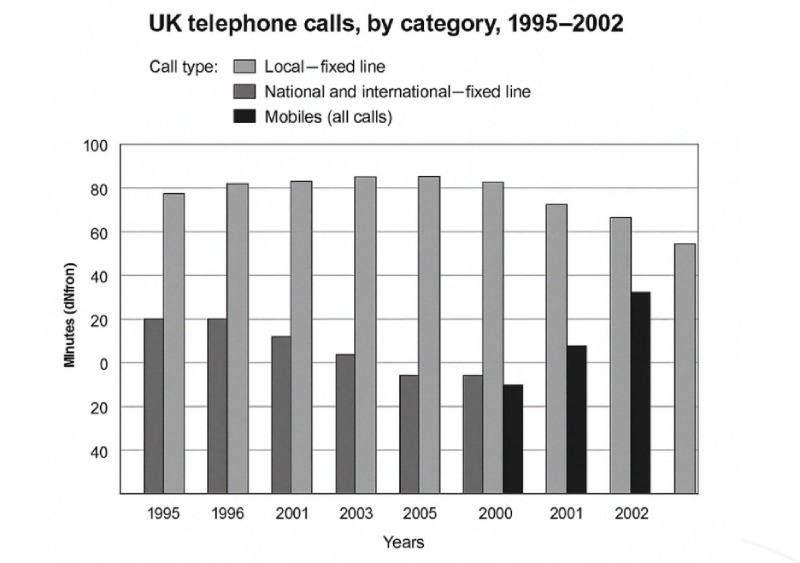
The chart below shows the total number of minutes (in billions) of telephone calls in the UK, divided into three categories, from 1995–2002. Summarise the information by selecting and reporting the main features, and make comparisons where relevant.
Bài mẫu band 9: (Nguồn: IELTS Simon)
The bar chart compares the amount of time spent by people in the UK on three different types of phone call between 1995 and 2002.
It is clear that calls made via local, fixed lines were the most popular type, in terms of overall usage, throughout the period shown. The lowest figures on the chart are for mobile calls, but this category also saw the most dramatic increase in user minutes.
In 1995, people in the UK used fixed lines for a total of just over 70 billion minutes for local calls, and about half of that amount of time for national or international calls. By contrast, mobile phones were only used for around 4 billion minutes. Over the following four years, the figures for all three types of phone call increased steadily.
By 1999, the amount of time spent on local calls using landlines had reached a peak at 90 billion minutes. Subsequently, the figure for this category fell, but the rise in the other two types of phone call continued. In 2002, the number of minutes of national / international landline calls passed 60 billion, while the figure for mobiles rose to around 45 billion minutes.
Xem thêm: Các bước làm bài IELTS Writing Task 1 Bar Chart bạn cần phải biết
3.3. Dạng bài Pie chart (Biểu đồ tròn)
Biểu đồ tròn thường thể hiện cơ cấu, tỷ lệ phần trăm của các thành phần trong một tổng thể.
Đề bài:
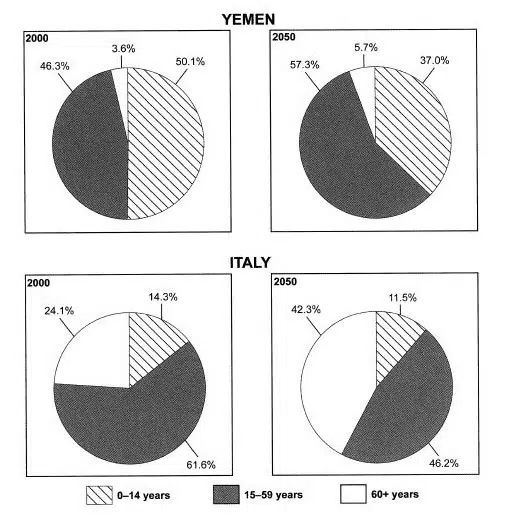
The charts below give information on the ages of the populations of Yemen and Italy in 2000 and projections for 2050. Summarise the information by selecting and reporting the main features, and make comparisons where relevant.
Bài mẫu band 9: (Nguồn: IELTS Advantaged)
The pie charts compare the proportions of Italian and Yemeni citizens in three age groups in 2000 and projections for 2050.
It is clear that Yemen had the younger population in the year 2000, and the same is predicted for the year 2050. The populations of both countries are predicted to get older over the 50 year period.
In 2000 just over half the Yemeni population were under 14, compared to just over 14% of Italians in the same age group. Only a very small percentage of people in Yemen were over 60 at 3.6%, in contrast to nearly a quarter of the Italian population. The largest group for Italy was the 15-59-year-olds with just over 60% while Yemen had 46.3% of its population in this category.
Yemen’s average age is set to increase with the proportion of over 60s increasing by just over 2% and the middle group rising by 11%, leaving the youngest group with a decrease of nearly 13%. It is envisaged that by 2050 the number of people in Italy over 60 will jump to 42.3%, the percentage of those in the youngest bracket will drop to 11.5% and the share in the middle category will decrease to 46.2%.
Xem thêm: Cách viết Writing Task 1 Pie Chart giúp bạn đạt điểm cao
3.4. Dạng bài Table (Bảng số liệu)
Đề bài cho một bảng số liệu chứa rất nhiều dữ liệu, yêu cầu người học chọn lọc thông tin liên quan để so sánh.
Đề bài:
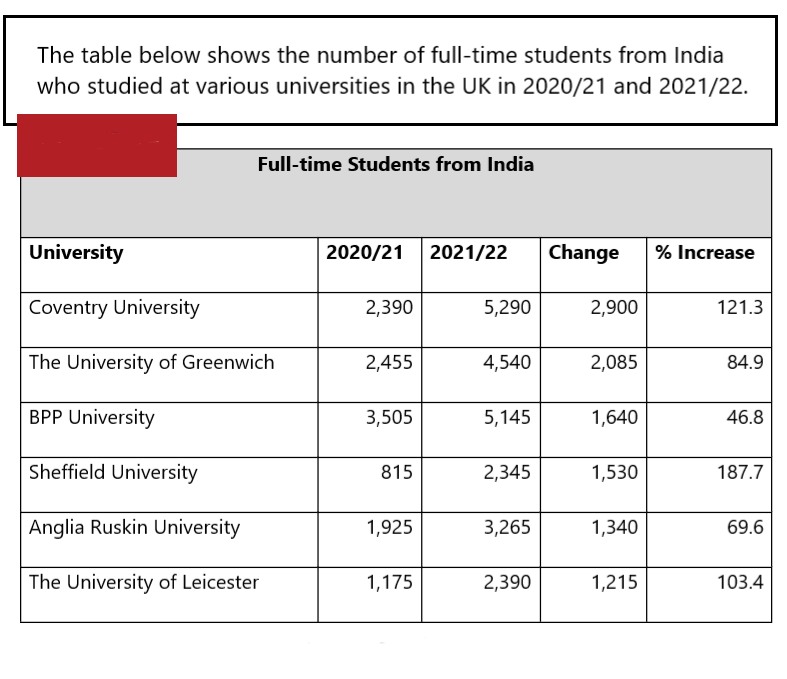
The table below shows the number of full-time students from India who studied at various universities in the UK in 2020/21 and 2021/22.
Bài mẫu band 9: (Nguồn: IELTS Liz)
The table gives information about how many full-time students coming from India studied in six British universities in two academic years (2020/21 and 2021/22) as well as the change in numbers and percentage increase.
Overall, the greatest increase in Indian students could be seen in Sheffield University, while BBP University showed the lowest increase over the two years. The university with the most students from India was BBP University in the first year and Coventry University in the second year.
Sheffield University saw a dramatic rise of 187.7% in India students reaching 2,345 in 2021/22. Likewise, the number also climbed considerably for Coventry University by 2,900 students (121.3%) to hit 5,290 students in 2021/22. Another significant increase was seen in Leicester University from 1,175 to 2,390 students, a rise of 103.4%.
All other universities saw an increase of under 100% in the number of Indian students over from 2020/21 to 2021/22. The number of students going to University or Greenwich and Anglia Ruskin University rose by 2,085 students (84.9%) and 1,340 (69.6%) respectively. Regarding BBP University, the number of students remained high in both years at 3,505 and 5,145, which was a growth of only 46.8%.
Xem thêm: Hướng dẫn cách viết IELTS Writing Task 1 Table dễ đạt điểm cao
3.5. Dạng bài Process/Diagram (Sơ đồ quy trình)
Dạng bài quy trình thường không có số liệu, nhiệm vụ của bạn là sử dụng ngôn ngữ để mô tả quy trình được thể hiện trong đề bài.
Đề bài:
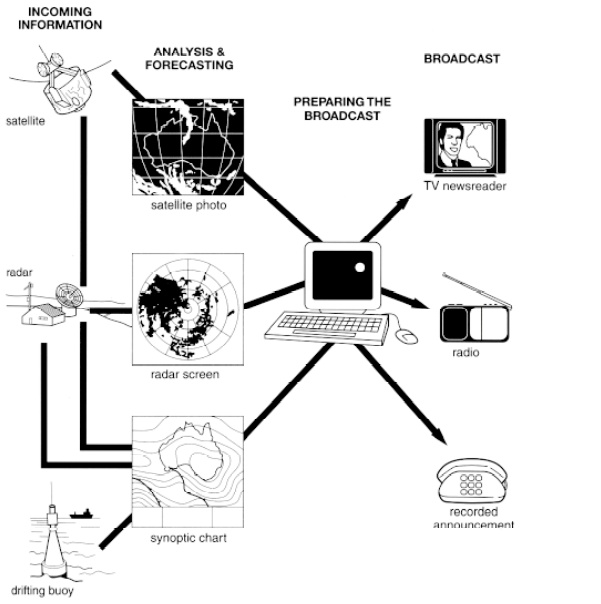
The diagram below shows how the Australian Bureau of Meteorology collects up-to-the-minute weather information to produce reliable forecasts.
Bài mẫu band 9: (Nguồn: IELTS Simon)
The figure illustrates the process used by the Australian Bureau of Meteorology to forecast the weather.
There are four stages in the process, beginning with the collection of information about the weather. This information is then analysed, prepared for presentation, and finally broadcast to the public.
Looking at the first and second stages of the process, there are three ways of collecting weather data and three ways of analysing it. Firstly, incoming information can be received by satellite and presented for analysis as a satellite photo. The same data can also be passed to a radar station and presented on a radar screen or synoptic chart. Secondly, incoming information may be collected directly by radar and analysed on a radar screen or synoptic chart. Finally, drifting buoys also receive data which can be shown on a synoptic chart.
At the third stage of the process, the weather broadcast is prepared on computers. Finally, it is delivered to the public on television, on the radio, or as a recorded telephone announcement.
Xem thêm: Hướng dẫn chi tiết cách viết Process/Diagram IELTS Writing Task 1
3.6. Dạng bài Map (Bản đồ)
Dạng bài Bản đồ yêu cầu bạn mô tả sự thay đổi, nâng cấp, mở rộng của một địa điểm qua thời gian.
Đề bài:
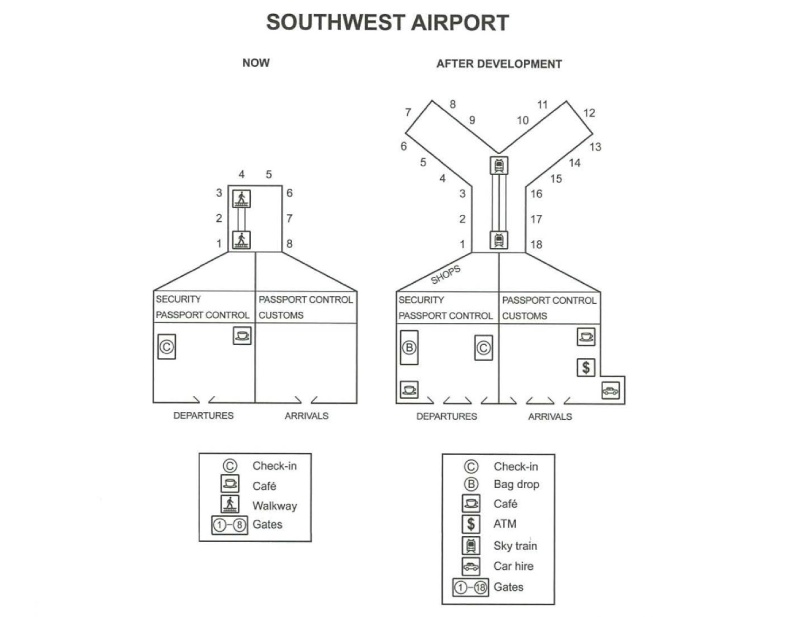
The plans below show the site of an airport now and how it will look after redevelopment next year. Summarize the information by selecting and reporting the main features, and make comparisons where relevant.
Bài mẫu band 9: (Nguồn: Cambridge IELTS 16, Pauline Cullen)
The two plans show Southwest Airport as it is now and redevelopment plans for next year. Overall, the number of gates will increase significantly, while the main building will generally remain unchanged apart from the addition of more passenger facilities.
The current airport has very few facilities for departing passengers, with only a coffee shop on the right-hand side, opposite a check-in counter. There are no facilities beyond passport control and security, and passengers have to walk to the eight departure gates. Arriving passengers have no amenities at all.Following redevelopment, both arriving and departing visitors are better catered for, beginning with double the number of entrances and exits. In the departures area, the coffee shop will move to the opposite side, closer to the front, and the check-in desk will take its place, making room for a new baggage drop counter. Although the security area will not change, beyond this section, passengers will be able to shop and can use the new sky train service to reach the expanded gate area, with ten additional gates. Arriving passengers will also have access to a coffee shop and a currency exchange. The only structural change to the main building is a small annex in the front right-hand corner, where passengers will be able to hire a car.
Xem thêm: Các bước làm dạng bài Map trong IELTS Writing Task 1
Tạm kết
IELTS Writing Task 1 không quá đáng sợ nếu bạn nắm vững cấu trúc và phân loại được các từ vựng đặc trưng cho từng dạng bài. Việc tham khảo các bài mẫu IELTS Writing Task 1 Band 9 phía trên sẽ giúp bạn định hình được tư duy viết bài ngắn gọn, súc tích nhưng cực kỳ hiệu quả.
Bạn cũng có thể tham khảo [Ebook] Tổng hợp 50 bài mẫu IELTS Writing Task 1 & 2 (Band 7.0+) để làm quen với các dạng bài thường gặp, học cách phát triển ý tưởng, sử dụng từ vựng học thuật nhé!
Đừng quên tham gia học IELTS miễn phí tại Website của The IELTS Workshop để học các dạng bài Writing từ các thầy cô 9.0 IELTS nhé!