Hy vọng rằng bài mẫu chủ đề Number of international conferences in three cities dưới đây do thầy Nguyễn Tuấn Ngọc hướng dẫn sẽ giúp bạn nắm được cách triển khai một bài IELTS Writing Task 1 hoàn chỉnh.
1. Phân tích và hướng dẫn
1.1. Đề bài
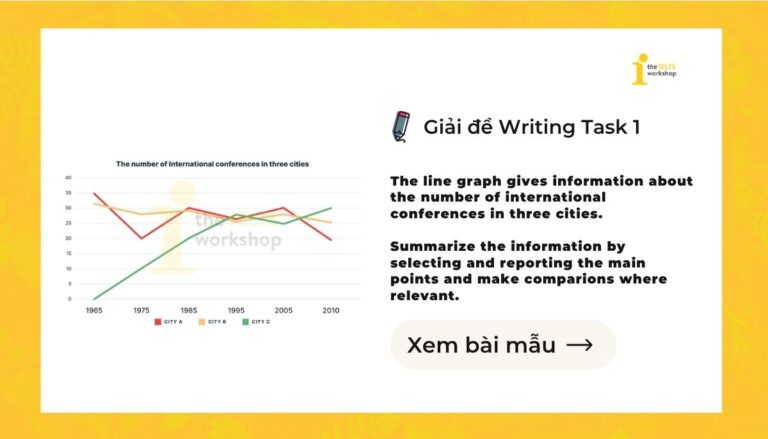
The line graph gives information about the number of international conferences in three cities. Summarize the information by selecting and reporting the main points and make comparions where relevant.
(Biểu đồ đường cung cấp thông tin về số lượng hội nghị quốc tế tại ba thành phố. Hãy tóm tắt thông tin bằng cách lựa chọn và trình bày những đặc điểm chính, đồng thời đưa ra các so sánh khi phù hợp.)
1.2. Phân tích đề bài
- Dạng bài: biểu đồ đường (line graph)
- Chủ đề: số lượng hội nghị quốc tế ở 3 thành phố
- Thời gian: 1965 – 2010
- Yêu cầu: tóm tắt đặc điểm chính và so sánh giữa các thành phố
Xem thêm: Hướng dẫn cách viết dạng bài Line Graph
1.3. Dàn bài chi tiết
Introduction
- Paraphrase đề bài:
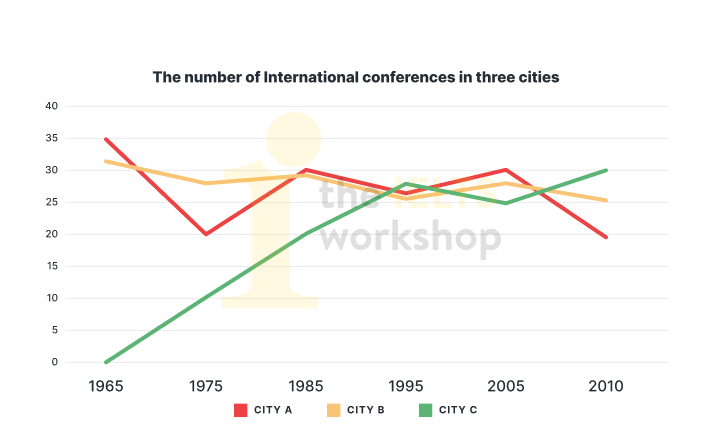
- The line chart illustrates the number of international conferences held in three cities (A, B, and C) between 1965 and 2010.
Overview
- City A and B were initially the leading venues but generally lost popularity over time.
- City C experienced a strong upward trend and eventually became the most popular destination by 2010.
- The figures for the three cities fluctuated throughout the period.
Body Paragraph 1 (1965–1995)
- City A
- Started highest at 35 conferences in 1965.
- Fell sharply to 20 in 1975.
- Recovered to 30 in 1985.
- City B
- Began at 31 conferences.
- Slight declines but remained the leading city during part of this period.
- City C
- Started at 0 conferences.
- Rose steadily over 30 years.
- Increased by about 10 conferences every decade.
- Overtook city A and B in 1995 with around 28 conferences.
Body Paragraph 2 (1995–2010)
- City A
- Rebounded to 30 conferences in 2005.
- Then dropped dramatically to 20 in 2010 (lowest point).
- City B
- Increased slightly to 26 in 2005.
- Declined moderately to 25 in 2010.
- City C
- Experienced a temporary decline after 1995.
- Recovered strongly and peaked at 30 conferences in 2010.
- Became the most popular venue by the end of the period.
2. Bài mẫu
The line chart illustrates the number of international conferences held in three different venues, namely city A, B, and C, over a 50-year period from 1965 to 2010.
In general, city A and B, originally more popular destinations for international conferences, lost their appeal over the 40-year period, in contrast to the notable rise of city C as a new, promising alternative location, even surpassing its counterparts by the end of the period.
In 1965, city A held 35 international conferences – the highest number in the chart, followed closely by city B with 31 conferences, whereas there were no conferences organised in city C. Over the following 20 years, trends varied significantly across the three cities. The figure for city A plunged to an all-time low of 20 in 1975 before rising strongly again to 30 in 1985, while city B, despite slight decreases compared to 1965, became the most popular destination for international conferences during this period. From 1985 to 2005, city A and B followed a similar pattern, as numbers fluctuated between 25 and 30 events annually, with city A maintaining a marginally higher position. Most notably, city C increased steadily over the course of 30 years to become a promising new destination for international conferences. It hosted, on average, 10 more conferences every decade, and by 1995, roughly 28 conferences were held, for the first time marginally overtaking both city B and A.
From 1995 to 2005, city A and B welcomed more organisers and hosted, respectively, 30 and 26 events in 2005, reclaiming their leading positions, as opposed to a moderate decline in the number of conferences held in city C. However, this order was not sustained for long. From 2005 to 2010, city A organised merely 20 international conferences, equal to its lowest point recorded in 1975, becoming the least preferred venue among the three. City B also declined in popularity, although the drop was less pronounced, hosting 25 events in 2010 and ranking second. Most notably, city C managed to regain its appeal, hosting 30 conferences in 2010 – the highest number recorded over the period, surpassing the other two cities.
Sample by Nguyen Tuan Ngoc – IELTS Teacher at The IELTS Workshop
3. Từ vựng
- lost their appeal → mất đi sức hấp dẫn
- trends varied significantly → xu hướng thay đổi đáng kể / khác biệt rõ rệt
- plunged to an all-time low → giảm mạnh xuống mức thấp nhất mọi thời điểm
- followed a similar pattern → diễn biến theo xu hướng tương tự
- maintaining a marginally higher position → duy trì vị trí nhỉnh hơn một chút
- marginally overtaking → vượt lên nhẹ / nhỉnh hơn một chút
- reclaiming their leading positions → giành lại vị trí dẫn đầu
- the drop was less pronounced → mức giảm ít rõ rệt hơn / giảm nhẹ hơn
- regain its appeal → lấy lại sức hấp dẫn
Tạm kết
Mong rằng sau khi đọc xong bài mẫu trên học viên sẽ nắm rõ hơn cách triển khai và hoàn thiện bài IELTS Writing Task 1 dạng Line Graph. Đừng quên đọc thật kĩ bài mẫu do thầy Nguyễn Tuấn Ngọc hướng dẫn và ghi lại những kiến thức quan trọng để nâng cao hơn khả năng viết tiếng Anh của mình nhé.
Tham khảo tài liệu sau: [Cập nhật liên tục] Tổng hợp đề thi IELTS Writing 2026 kèm bài mẫu và Bài mẫu Writing Task 1 trên website. Đây là nguồn tài liệu hữu ích để bạn luyện kỹ năng mô tả số liệu, rèn khả năng so sánh và nắm bắt xu hướng trong biểu đồ từ đó nâng cao hơn band điểm của mình.
Ngoài ra, đừng quên tham khảo HỌC IELTS MIỄN PHÍ trên website để có cơ hội học trực tiếp cùng giảng viên giàu kinh nghiệm giảng dạy để nắm rõ các kĩ năng làm các dạng bài IELTS.