Hy vọng rằng bài mẫu The graph below shows the proportion of the population aged 65 and over between 1940 and 2040 in 3 different countries dưới đây do thầy Trương Minh Tiến hướng dẫn sẽ giúp bạn nắm được cách triển khai một bài IELTS Writing Task 1 hoàn chỉnh.
1. Phân tích và hướng dẫn
1.1. Đề bài
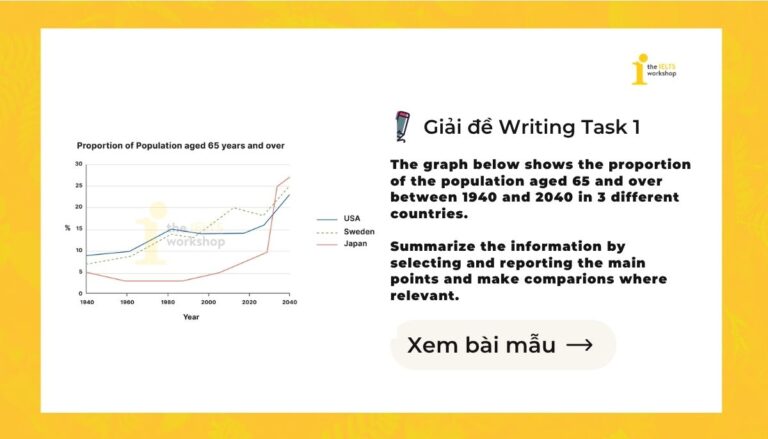
The graph below shows the proportion of the population aged 65 and over between 1940 and 2040 in 3 different countries. Summarize the information by selecting and reporting the main points and make comparions where relevant.
(Biểu đồ dưới đây cho thấy tỷ lệ dân số từ 65 tuổi trở lên trong giai đoạn từ năm 1940 đến năm 2040 ở ba quốc gia khác nhau. Hãy tóm tắt thông tin bằng cách lựa chọn và trình bày những đặc điểm chính, đồng thời đưa ra các so sánh khi phù hợp.)
1.2. Phân tích đề bài
- Dạng bài: Line graph
- Chủ đề: Tỷ lệ dân số ≥65 tuổi
- Thời gian: 1940 → 2040 (lưu ý: có dữ liệu dự đoán tương lai)
- Đối tượng: USA, Sweden, Japan
Lưu ý:
- Nên chia 2 giai đoạn (1940–1980 / 1980–2040)
- Xu hướng chung (key trends):
- Japan: thấp → tăng cực mạnh
- Sweden: tăng mạnh rồi hơi giảm
- USA: tăng ổn định
Xem thêm: Hướng dẫn cách viết dạng bài Line Graph
1.3. Dàn bài chi tiết
Introduction: Paraphrase đề bài
Overview:
- All increase
- Japan tăng mạnh nhất & sẽ đứng đầu
Body Paragraph 1 (1940 → 1980)
- Mỹ cao nhất năm 1940 (~9%)
- Thụy Điển đứng thứ hai (~7%)
- Nhật thấp nhất (~5%)
- Mỹ + Thụy Điển tăng đều đến 1980:
- USA: ~15%
- Sweden: ~13%
- Nhật giảm nhẹ rồi ổn định quanh 3%.
Body Paragraph 2 (1980 → 2040)
- Sweden
- tăng nhanh hơn
- đạt khoảng 20% năm 2010
- giảm nhẹ sau đó
- USA
- tăng vừa phải
- ổn định quanh 14–15% đến 2020.
- Japan
- bắt đầu tăng sau 1980
- tăng vọt mạnh sau 2020.
- Kết thúc: 2040
- Japan: 27%
- Sweden: 25%
- USA: 23%.
2. Bài mẫu
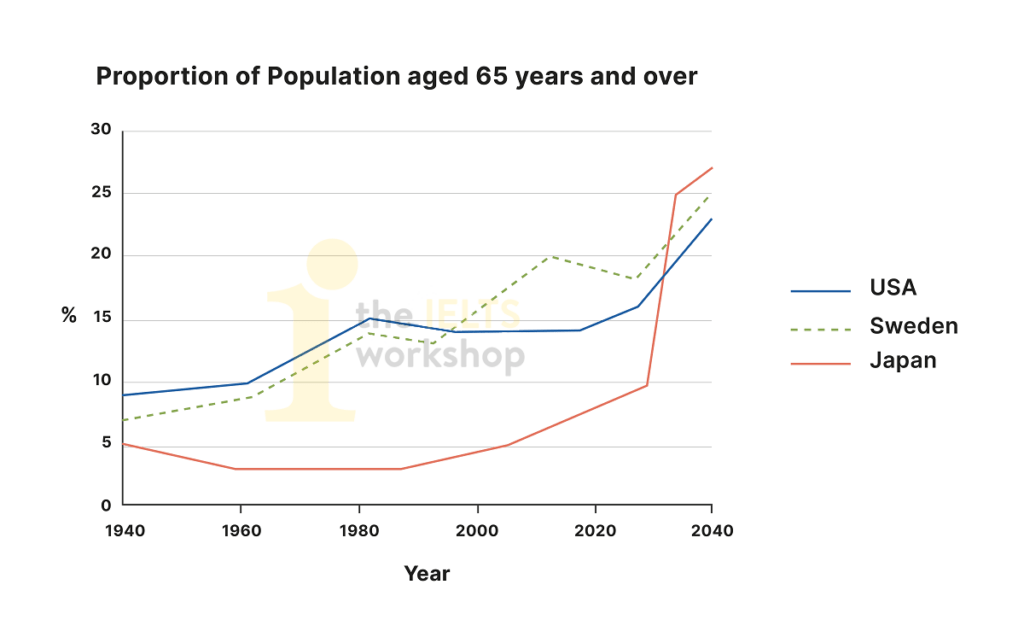
The line graph illustrates the proportion of people aged 65 and over in the USA, Sweden, and Japan between 1940 and 2040.
Overall, all three countries show an upward trend in the ageing population. Notably, Japan, which initially had the lowest figure, is projected to experience the most dramatic increase and become the country with the highest proportion by 2040. In contrast, the USA and Sweden follow more gradual and steady growth patterns.
In 1940, the USA recorded the highest proportion of elderly people at approximately 9%, followed by Sweden at around 7%, while Japan lagged far behind at about 5%. Over the next four decades, the figures for the USA and Sweden increased steadily, reaching roughly 15% and 13% respectively by 1980. Meanwhile, Japan saw a slight decline and remained relatively stable at around 3%.
From 1980 onwards, Sweden’s elderly population rose more sharply, peaking at about 20% in 2010 before experiencing a slight dip. The USA, however, showed a more moderate increase and remained fairly stable at around 14–15% until 2020. By contrast, Japan began to rise steadily after 1980, followed by a rapid surge after 2020.
By 2040, Japan is expected to surpass both Sweden and the USA, reaching approximately 27%, compared to 25% and 23% respectively.
Sample by Truong Minh Tien – IELTS Teacher at The IELTS Workshop
3. Từ vựng
Từ vựng:
- Lag far behind = tụt lại sau
- Surpass = vượt qua
- Projected to + V = được dự đoán sẽ
- A slight dip = sự giảm nhẹ
Cấu trúc:
Overview
- Overall, + S + show an upward trend
- Notably, + S + is projected to + V
- In contrast, + S + follow a more steady pattern
Body – mô tả xu hướng
- S + saw a gradual increase from A to B
- S + rose sharply, peaking at + number
- S + remained relatively stable at + number
- S + experienced a slight dip
So sánh
- S1 + had the highest…, followed by S2
- S1 + lagged far behind
- S1 + surpassed S2
Dự đoán (future)
- S + is expected to + V
- S + is projected to + V
Tạm kết
Mong rằng sau khi đọc xong bài mẫu trên học viên sẽ nắm rõ hơn cách triển khai và hoàn thiện bài IELTS Writing Task 1 dạng Line Graph hoàn chỉnh. Đừng quên đọc thật kĩ bài mẫu do thầy Trương Minh Tiến hướng dẫn và ghi lại những kiến thức quan trọng để nâng cao hơn khả năng viết tiếng Anh của mình nhé.
Tham khảo tài liệu sau: [Cập nhật liên tục] Tổng hợp đề thi IELTS Writing 2026 kèm bài mẫu và Bài mẫu Writing Task 1 trên website. Đây là nguồn tài liệu hữu ích để bạn luyện kỹ năng mô tả số liệu, rèn khả năng so sánh và nắm bắt xu hướng trong biểu đồ từ đó nâng cao hơn band điểm của mình.
Ngoài ra, đừng quên tham khảo HỌC IELTS MIỄN PHÍ trên website để có cơ hội học trực tiếp cùng giảng viên giàu kinh nghiệm giảng dạy để nắm rõ các kĩ năng làm các dạng bài IELTS.